The original article was written in 2021. This is a 2024 summary / rewrite.
⚠️ !!! Update from Me in 2024 !!!
All of the data was gathered from Niche.com, which presents a data bias and data scarcity issue. The data is biased in the sense that “only people who have scored very well on the SATs will bother reporting their scores”. Otherwise I expect to see a mean score equal to whatever CollegeBoard says since all raw scores are scaled.
Take any conclusions in this super outdated article with a grain of salt.
Looking at the correlation between SATs, GPAs, and college admissions.
The class of 2021’s college decisions were brutal, well depending on how much time and effort you actually put into school before COVID-19. Few colleges that I applied to even considered standardized test scores in their admissions process, but I wanted to know,
If COVID-19 didn't screw everything up, would I have gotten in some of the schools I applied to?
That’s a question that I, and many former high school students, wanted to know the answer to. So, over the span of a week, I scraped the admitted / rejection data from niche.com to analyze the effectiveness of linear, tree, and kernelized methods on the binary classification problem behind an applicant’s admission.
How the College Decision Process Probably Works
2021’s college decision process was heavily based on your essays. I’m a terrible writer so this was claerly a major setback for me, but normally the reviewers behind your application make a decision based on five things (ranked by order of importance):
- SATs
- GPAs
- Your classes’ difficulty
- Extracurriculars (leadership, clubs, sports, etc.)
- College Essay
The admissions process is more or less a black box (and subject to quite a bit of randomness and luck), but these five are the basics of it. You can Google around for other sources if you want.
Gathering the Data
If I’m being completely honest, this part was the bulk of the project. No, I didn’t gather the data manually, but instead wrote a script to do so. All source code will be linked near the footer of this article. The problem was that niche.com has a really strict anti-automation system so it was just as slow as gathering data by hand. This process came with a bunch of technical challenges but I managed to get the data for 1000 colleges ranked according to however niche.com ranks them.
The data was just the SAT score, GPA, in/out of state status, intended major, and admit / rejection status of applicants.
Training the SVM Model
I chose to fit the data to an SVM model first because of how non-linear the regions between admitted and accepted points were. Just by looking at the plots on niche.com, you will notice that there’s some distinction between rejections and acceptance points, but defining regions for either of them is hard since you’d always miss out on some points.
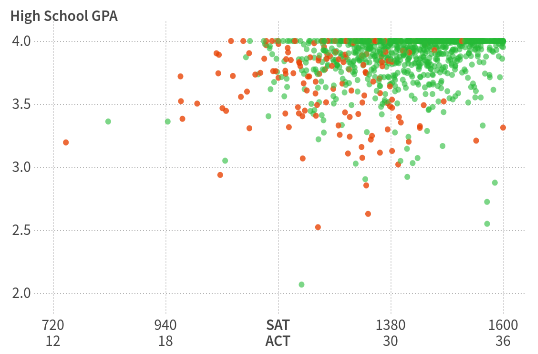 Murky regions of acceptance and denials
SVMs are usually good at dealing with these kinds of problems. In short, they can take advantage of a kernel trick which is mapping training data into higher dimensions, without actually doing so, with some sort of kernel function (it’s usually radial basis).
I tested the SVM model on a few schools, but the results weren’t as promising as some of the other classifiers.
Training the Logistic Regression Linear Classifier
Similar to SVMs, Logistic Regression (LR for short) models are capable of using the kernel trick to classify non-linearly separable data.
Unlike the SVM method, the LR method will separate higher dimensional data with a ‘hyper-plane’ instead of using support vectors.
The biggest advantage that comes with this is that it lets you see the coefficient of each feature using both radial basis and linear kernel functions.
With the default regularization parameters, LR achieved promising results:
output/taylor-university.txt
Accuracy: 0.993 ± 0.0138
[[-0.4286  0.5369  0.2002]]

output/roanoke-college.txt
Accuracy: 0.993 ± 0.00912
[[-0.1142  1.2523  0.3643]]

output/calvin-university.txt
Accuracy: 0.992 ± 0.00961
[[-0.3598  0.6971 -0.4077]]

output/oral-roberts-university.txt
Accuracy: 0.992 ± 0.0121
[[0.2812 0.5206 0.2384]]

output/bethel-university---minnesota.txt
Accuracy: 0.992 ± 0.0167
[[0.0103 1.4109 0.5016]]
...
99% Accuracy???! These were results were… too promising… ![]()
I looked up Taylor University’s plot and quickly realized what was happening. Despite having a 67% acceptance rate, they only have two reported rejections shown on the plot, which means that the model could literally just guess “accepted” all the time and be correct 99% of the time.
To accomodate for this, I added a condition to make sure that there had to be at least 100 rejections from the school in order to be trained on the models. This condition alone pruned 805 of the 1000 colleges!
And training the models on the pruned colleges and evaluating their performance through k-fold validation:
arizona state university
Accuracy: 0.978 ± 0.00144
[ 0.1741  0.2851  0.5891  0.8858]
  MAJOR   IN/OUT  SAT     GPA
          STATE

drexel university
Accuracy: 0.97 ± 0.00389
[ 0.0341  0.      2.2142  0.372 ]

st johns university   new york
Accuracy: 0.969 ± 0.00402
[ 0.1947  0.      2.0901  0.1475]

indiana university   bloomington
Accuracy: 0.967 ± 0.00423
[ 0.0171  0.2567  1.4614  0.7663]

louisiana state university
Accuracy: 0.963 ± 0.00574
[ 0.0365  0.0048  1.3641  0.792 ]

michigan state university
Accuracy: 0.959 ± 0.00513
[ 0.0914  0.1179  0.5098  0.9509]
...
These model accuracies are still pretty high, which honestly surprised me since the decision process is heavily weighted by the quality of your essays.
You can see that the four columns on the third row of every school represents major, state-status, SAT score, and GPA respectively. Most schools don’t care too much about your in-state or out of state status. Another surprising observation is that schools that have in/out of state statuses rank the state status importance above the intended major.
Other Classification Models
Decision trees and linear regression classifiers were among the other models I tried, however, none of them had any high accuracies when fitted to the data. Linear regression classifiers are understandably weak for classification of this kind of data but my only explanation for the decision trees is that maybe the tree depth was too shallow?
Conclusion
So do your GPAs and SATs matter? Yes, they matter.
But how much? Well, you have to look at which school. If we look at Pitzer College’s results,
pitzer college
Accuracy: 0.58 ± 0.0647
[0.0955 0.     0.2339 0.3411]
You can see that SAT and GPA only matter slightly. In fact, their plot over at niche.com shows no discernable trend with the two features since all the points are mixed in with each other.
You can see that models fitted Ivy League school data have around 70-80% accuracy. This is because there’s so many applicants applying to those schools that they have to be very selective with people who already have high SATs and GPAs.
The full list is located here. (2024 edit: link is broken.)
You can find the source code for the tool over on my Github.